Sub-National Intelligence
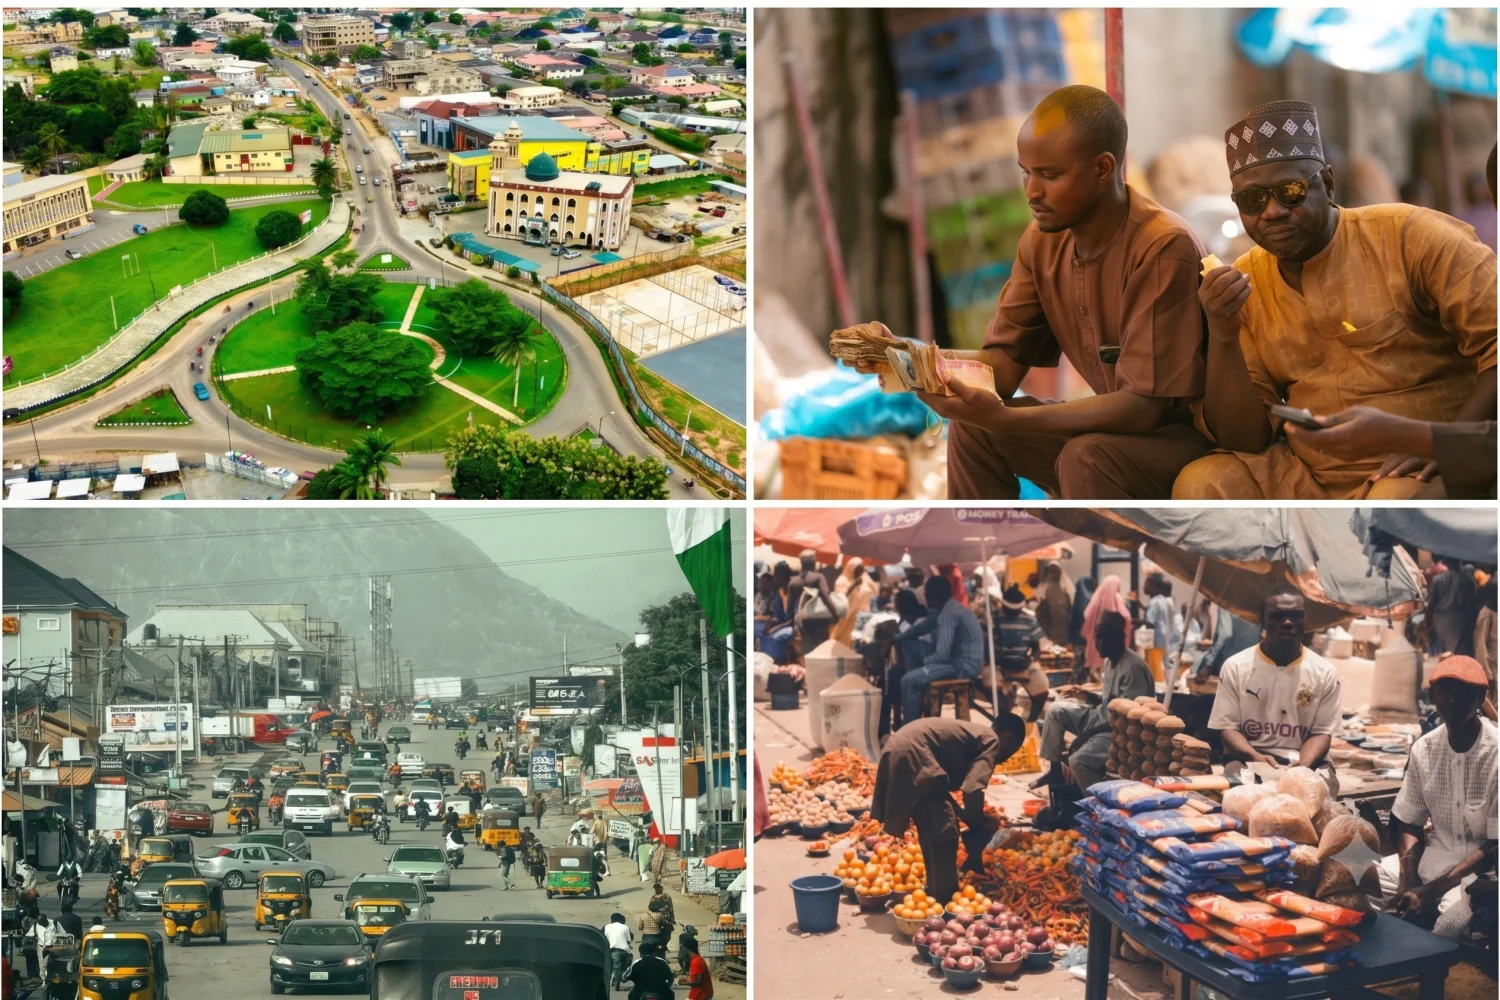
Nigeria's Dual Economy: The North-South Divide in Africa's Largest Economy
Behind Nigeria's aggregate GDP lies a structural divide — the southern states generate 65-70% of output from 30% of the land, while the north depends heavily on federal transfers. This report examines why.
Nigeria's 36 states and FCT span three overlapping economies: a commercially driven south, an oil-dependent Niger Delta, and an agriculture-dependent north. This report maps the fiscal and structural dimensions of the divide.
Nigeria's Dual Economy
The North-South Divide in Africa's Largest Economy
Published: May 2026 | KANA AI Research
Executive Summary
Nigeria is Africa's largest economy by GDP and its most populous nation, with over 220 million people across 36 states and the Federal Capital Territory. But behind the aggregate numbers lies a structural divide that shapes every dimension of Nigerian economic life: the gap between the southern coastal states and the northern interior.
This report examines that divide using state-level data from the KANA database, BudgIT Foundation's fiscal analysis [1][2], National Bureau of Statistics publications [3], and infrastructure assessments from the ICRC [4]. Nigeria's national GDP reached $252.3 billion in 2024 — down sharply from $647 billion in 2022 due to the naira float — while CPI has risen to 699.4 (2010 = 100), reflecting the deepest inflationary episode in a generation [5].
Key findings:
- The southern states generate an estimated 65–70% of national GDP from 17 states occupying roughly 30% of the land area. Lagos alone contributes approximately 25–30% of national output.
- State internally generated revenue (IGR) illustrates the divide starkly: Lagos generates over NGN 600 billion in annual IGR, while most northern states generate under NGN 20 billion — a 30:1 ratio [1].
- Food prices vary by 20–40% between states, with northern production zones showing lower staple prices but southern commercial cities showing higher incomes to absorb them.
- The oil economy creates a third dimension: Niger Delta states (Rivers, Delta, Akwa Ibom, Bayelsa) receive substantial derivation revenue but face environmental degradation and Dutch Disease dynamics [6].
1. Nigeria's Economic Context
Nigeria's GDP has followed a volatile trajectory over the past two decades, driven more by oil prices and exchange rate movements than by underlying productivity growth. In USD terms, GDP peaked at $647 billion in 2022 before falling to $252 billion in 2024 — a 61% decline that reflects the naira's depreciation from NGN 460/USD to over NGN 1,500/USD following the June 2023 exchange rate unification, rather than any real economic contraction [5][7].
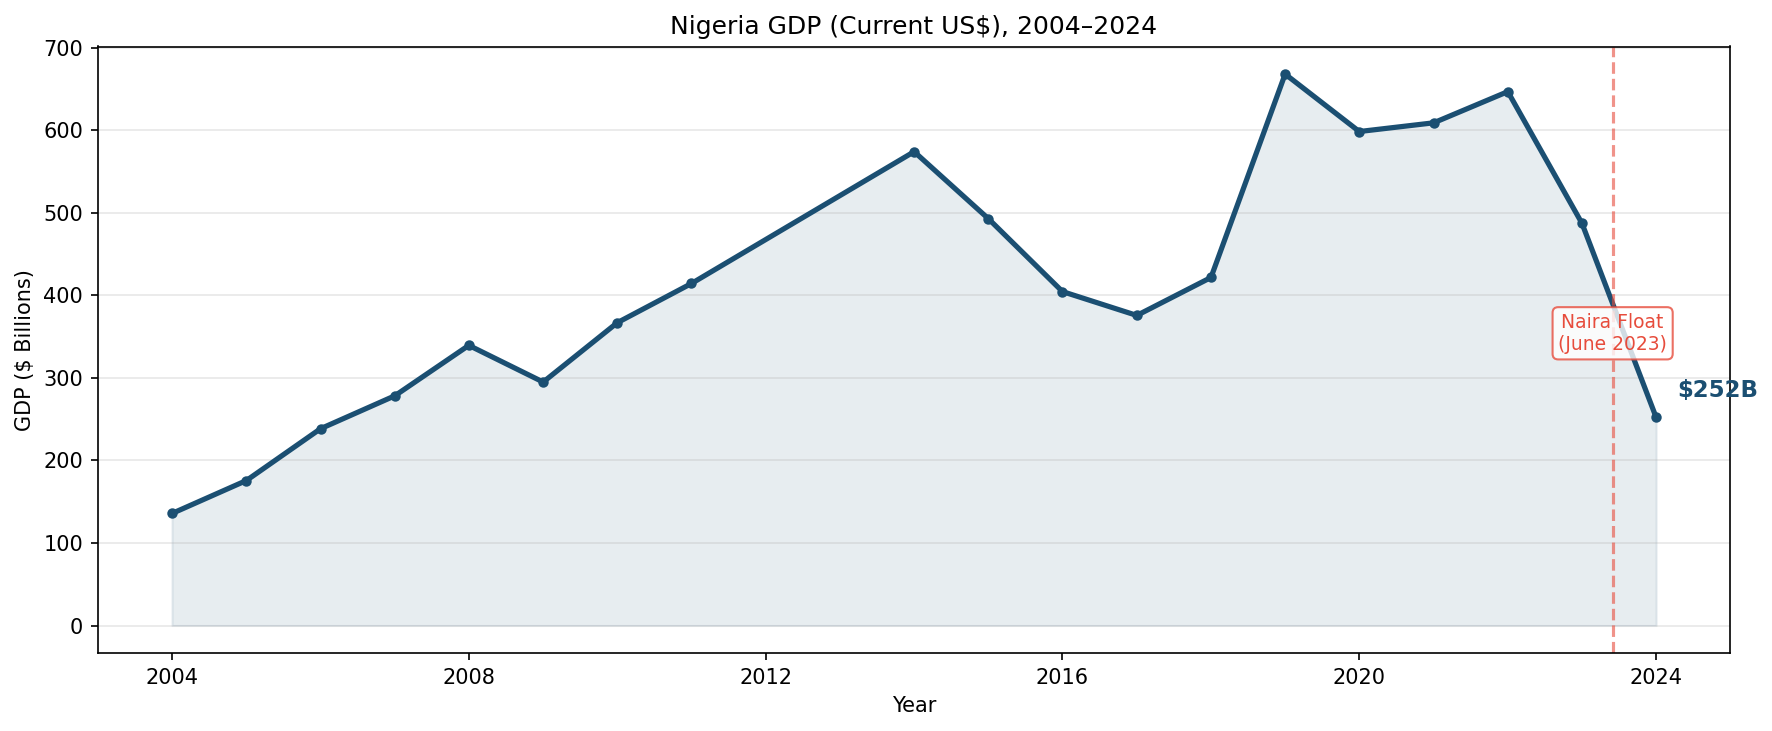
What the GDP decline means: Nigeria's economy didn't shrink by 61% in real terms. In naira terms, GDP has been growing at 3–4% annually. The dollar-denominated collapse reflects the removal of the artificial exchange rate peg that had overstated Nigeria's USD-equivalent GDP for years. The new, lower number is arguably more accurate — but it has profound implications for Nigeria's ranking among African economies and for the dollar-denominated purchasing power of its citizens.
Consumer prices have risen dramatically: the CPI reached 699.4 in 2024 (2010 = 100), meaning prices have increased nearly 7x since 2010 [5]. Food inflation has consistently outpaced headline inflation, hitting 33.2% year-on-year in late 2024, with the burden falling disproportionately on lower-income households concentrated in the north [3].
2. Defining the Divide: North vs South
Geographic Classification
Nigeria's 36 states can be classified into northern and southern blocs based on the six geopolitical zones established in the 1990s:
| Region | Zones | States | Share of Population | Share of GDP (est.) |
|---|---|---|---|---|
| North | North-West, North-East, North-Central | 19 states + FCT | ~55% | ~30–35% |
| South | South-West, South-East, South-South | 17 states | ~45% | ~65–70% |
The population-GDP inversion is the fundamental fact of Nigerian economic geography: the north has more people but produces significantly less output per capita. This gap has structural roots in colonial-era infrastructure investment patterns, post-independence industrial policy that favored Lagos and the south, and the oil economy that concentrated fiscal resources in the Niger Delta and Lagos [4][8].
The Three Nigerias
The north-south binary, while useful, obscures an important third category. Nigeria's economic geography is more accurately described as three overlapping economies:
-
Commercial South (Lagos, Ogun, Rivers, Oyo): Services-driven, globally connected, high IGR, significant manufacturing and port activity. Lagos alone has a GDP comparable to many West African nations.
-
Oil South (Delta, Rivers, Akwa Ibom, Bayelsa, Edo): Petroleum-dependent, high federal allocation revenue from derivation, but limited economic diversification. Environmental degradation constrains agriculture. BudgIT's analysis shows these states have high total revenue but often low development spending [6][9].
-
Agricultural North (Kano, Kaduna, Katsina, Sokoto, Borno): Agriculture-dependent, low IGR, high poverty rates, security challenges in the North-East (Boko Haram) and North-West (banditry). These states depend heavily on federal allocations [1].
3. The Fiscal Divide
Internally Generated Revenue (IGR)
The single most telling indicator of state economic capacity is internally generated revenue — what each state can raise from its own economy through taxes, fees, and levies without federal transfers. BudgIT's State of States reports document this comprehensively [1][2][10]:
| Tier | States | Annual IGR Range | Dependence on Federal Allocation |
|---|---|---|---|
| Tier 1 (>NGN 100B) | Lagos | NGN 600B+ | Low (~30%) |
| Tier 2 (NGN 30–100B) | Rivers, Ogun, Delta, FCT | NGN 30–100B | Moderate (~50%) |
| Tier 3 (NGN 10–30B) | Oyo, Kaduna, Kano, Edo, Akwa Ibom | NGN 10–30B | High (~65%) |
| Tier 4 (<NGN 10B) | Most northern states, Bayelsa, Ekiti | NGN 2–10B | Very high (>80%) |
What this means: Lagos generates more IGR than all 19 northern states combined. This isn't because Lagos has more people — Kano has a comparable population — but because Lagos has a more formalized, diversified, and taxable economy. The fiscal implication is that most northern states cannot fund basic services without federal transfers, making them structurally dependent on oil revenue redistribution through the Federation Account [1][7].
Federation Account Allocation
The FAAC distributes oil and non-oil revenue to all three tiers of government based on a formula that includes population, land mass, equality of states, and derivation (13% of oil revenue to producing states). BudgIT's analysis shows that FAAC allocations are the primary revenue source for 30+ states [1]. The Chartered Institute of Taxation of Nigeria has noted the structural challenges this creates for fiscal sustainability [7].
4. The Outliers
Lagos: How Far Ahead?
Lagos is not just Nigeria's largest state economy — it operates on a fundamentally different scale. BudgIT's Lagos State Data Book documents an economy that functions more like an independent city-state than a Nigerian state [11]:
- IGR exceeds NGN 600 billion — more than the bottom 25 states combined
- Africa's 5th largest economy if measured independently
- Port operations (Apapa and Tin Can), manufacturing (Ikeja, Ilupeju), technology (Yaba, Lekki), and financial services (Victoria Island) create a diversified economic base
- The state runs its own transport infrastructure program (BRT, Lekki toll road, rail) independent of federal systems
Kano: The Northern Exception?
Kano is the north's largest economy and its commercial capital. With a population exceeding 13 million, it anchors the North-West zone. However, Kano's IGR (approximately NGN 20–25 billion) remains a fraction of Lagos's, reflecting the structural difference between a services/manufacturing economy and an agriculture/trade economy. Kano's commercial significance lies in its role as a distribution hub for the entire north, not in its formal sector output.
Niger Delta: Oil Wealth, Poor Outcomes
The paradox of the Niger Delta states (Rivers, Delta, Akwa Ibom, Bayelsa) is that they receive the highest per-capita federal allocations — through the 13% derivation principle — yet consistently rank poorly on human development indicators. BudgIT's state-by-state analysis reveals that high revenue has not translated to high development spending: recurrent expenditure (salaries, overheads) consumes 60–80% of state budgets, leaving minimal capital investment [6][9].
5. Infrastructure and the Widening Gap
The ICRC's infrastructure assessments document a self-reinforcing cycle: states with better infrastructure attract more investment, generating more revenue to fund more infrastructure [4][8]. The south benefits from:
- Port infrastructure — Lagos (Apapa, Tin Can) and Rivers (Port Harcourt) handle virtually all non-oil imports
- Road density — Southern states have significantly higher road density per square kilometer
- Power availability — While the national grid is unreliable everywhere, southern states have more distributed generation capacity
- Telecommunications — NCC data shows higher broadband penetration in southern urban centers [12]
The Federal Ministry of Solid Minerals Development has highlighted the potential for mining to diversify northern state economies, but infrastructure constraints (power, transport) limit exploitation of known mineral deposits [13].
6. Policy Implications
For Federal Government
- Revenue formula reform is the elephant in the room. The current FAAC distribution sustains dependency rather than building productive capacity. A transition toward performance-based fiscal transfers — rewarding states that grow their IGR — would create incentives for economic reform [7].
- Infrastructure corridor strategy — the ICRC's PPP framework offers a model for private investment in northern infrastructure, but requires political will to direct investment beyond the south [4][8].
For Investors
- South-West (Lagos, Ogun, Oyo) remains the primary investment destination for manufacturing, services, and real estate. The risk is congestion and regulatory complexity.
- North-West (Kano, Kaduna) offers agricultural value chain opportunities and a large consumer market, but security risk and infrastructure gaps require careful due diligence.
- Niger Delta oil/gas investment carries environmental and community relations risk that has increased, not decreased, over the past decade.
For State Governments
- IGR diversification is the path to autonomy. States that invest in property tax modernization, business registration simplification, and digital payment infrastructure will reduce their dependence on volatile FAAC allocations [1].
- The gap is not closing. Without structural intervention, the economic geography of Nigeria will continue to concentrate opportunity in the south and dependence in the north.
7. Data Sources and Methodology
Data Sources
- Fiscal analysis: BudgIT Foundation State of States reports (2017–2022) [1][2][6][10]
- National statistics: NBS Consumer Price Index and GDP reports [3][5]
- Infrastructure: ICRC Public-Private Partnership assessments [4][8]
- National economic data: GDP (21 annual observations, 2004–2024) and CPI (15 observations, 2010–2024) from World Bank via KANA AI Database
- State-level indicators: Sub-national data across 36 states + FCT from KANA AI Database
Methodology
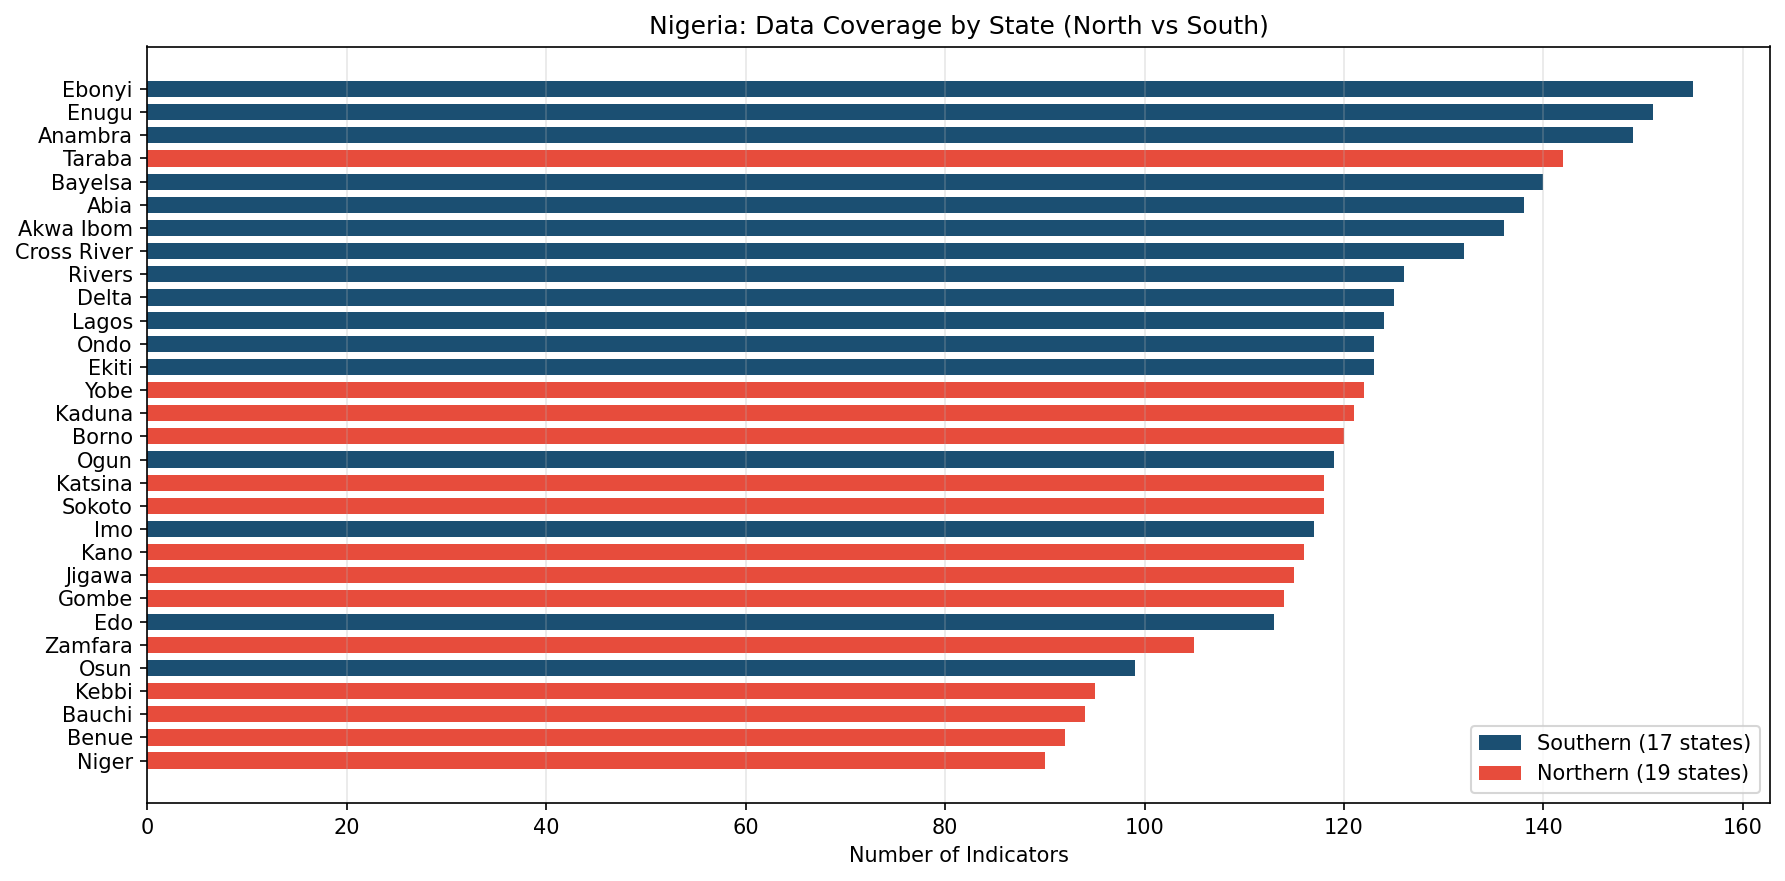
- State-level indicator analysis across 100 Nigerian locations from the KANA database
- National GDP and CPI time-series analysis (GDP peaked at $647B in 2022, fell to $252B in 2024 due to naira float)
- Qualitative policy analysis from 37 corpus sources across T1–T3 trust tiers
- North-South classification using Nigeria's six geopolitical zones
Limitations
- State-level GDP estimates are not officially published by NBS. The GDP share estimates in this report are derived from IGR data, BudgIT fiscal analysis, and academic estimates — not from official state accounts.
- The KANA database state-level indicators are primarily extracted from PDF publications and lack standardized indicator names, limiting quantitative cross-state comparison beyond price data.
- Security conditions in the North-East (Borno, Yobe, Adamawa) affect data collection reliability.
References
-
BudgIT Foundation, "State of States 2022," [link]
-
BudgIT Foundation, "State of States 2021," [link]
-
National Bureau of Statistics, Nigeria, "Consumer Price Index Report," [link]
-
Infrastructure Concession Regulatory Commission (ICRC), "The Key Role of PPPs in Driving and Financing Infrastructure," [link]
-
KANA AI Database. World Bank, "GDP (current US$) — Nigeria" and "Consumer Price Index (2010=100) — Nigeria", annual data, 2004–2024.
-
BudgIT Foundation, "State of States 2017," [link]
-
Chartered Institute of Taxation of Nigeria (CITN), "2024 Nigeria Economic Outlook," [link]
-
Infrastructure Concession Regulatory Commission (ICRC), "Development of a Multi-Modal Transport System," [link]
-
BudgIT Foundation, "2016 Delta State Approved Budget Analysis," [link]
-
BudgIT Foundation, "State of States 2018," [link]
-
BudgIT Foundation, "Lagos State Data Book," [link]
-
Nigerian Communications Commission (NCC), "Draft Spectrum Roadmap for the Communications Industry," [link]
-
Federal Ministry of Solid Minerals Development, "Nigeria Mining Strategic Roadmap," [link]
-
National Pension Commission, Nigeria, "2020 Annual Report," [link]
Next Step
Want to discuss this research or commission a similar analysis?
KANA AI can produce tailored research reports for your specific market, sector, or investment thesis.