Commodity Intelligence
The Maize Price Corridor: How Global Commodity Prices Transmit to Ghana, Nigeria, Kenya, and South Africa
Analysis of 25 years of maize price data reveals how global commodity shocks transmit differently across four African economies based on trade position, food security infrastructure, and policy response capacity.
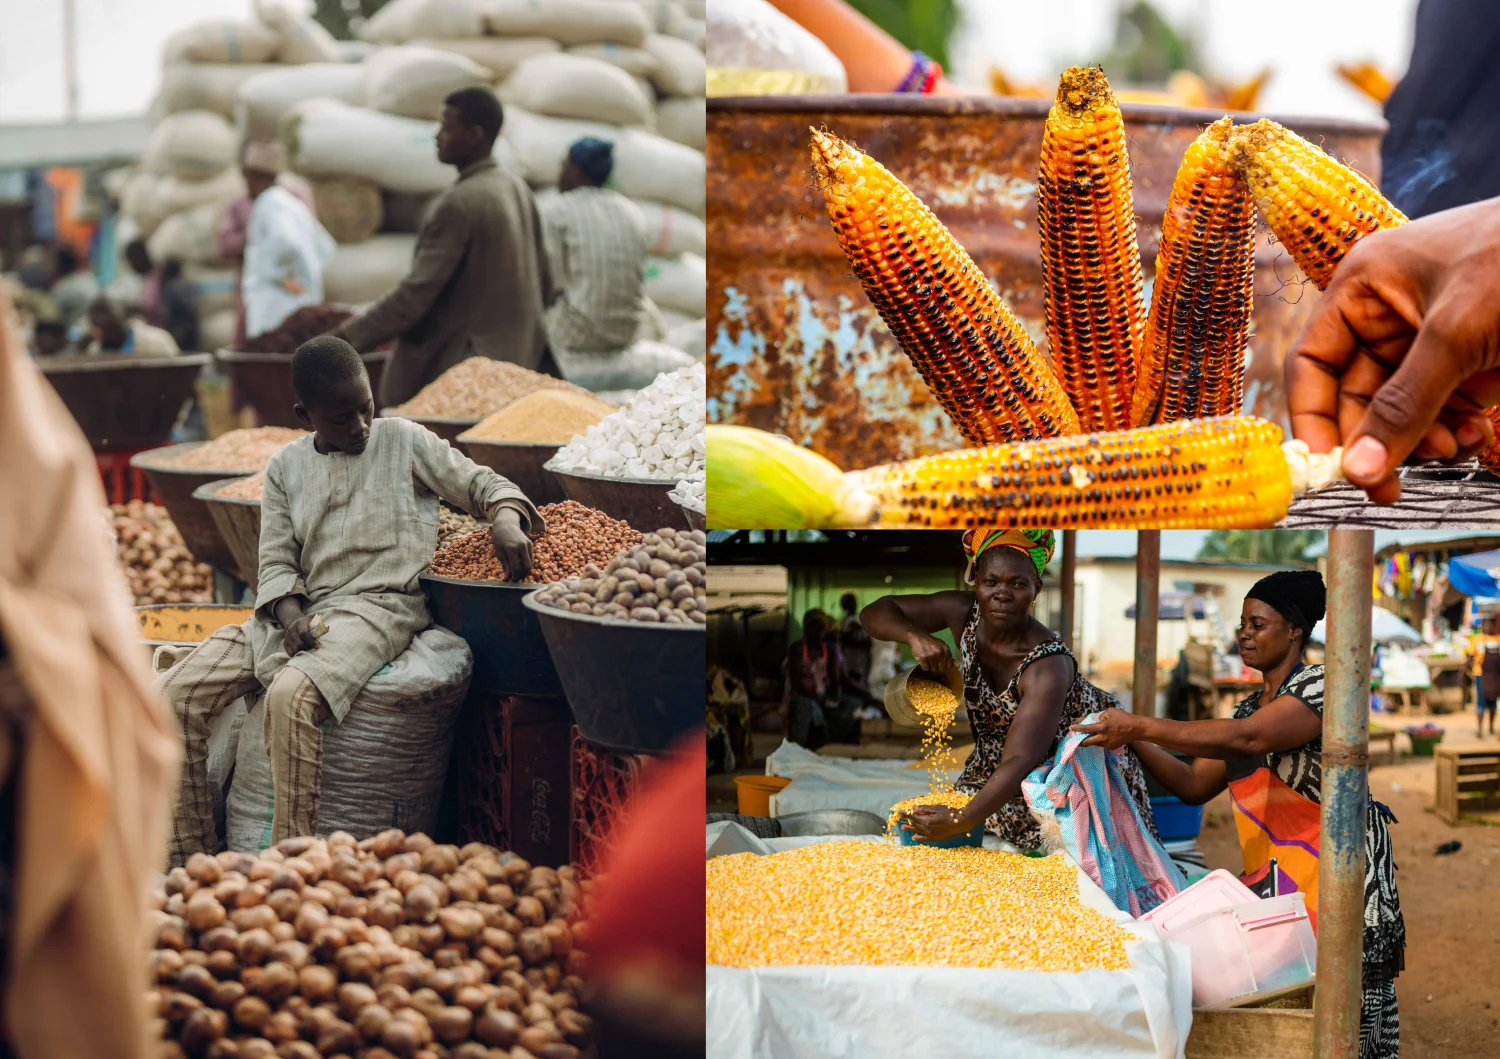
Maize is the most widely consumed cereal in Sub-Saharan Africa. This report examines 1,269 monthly price observations across four countries to understand price transmission dynamics.
The Maize Price Corridor
How Global Commodity Prices Transmit to Ghana, Nigeria, Kenya, and South Africa
Published: May 2026 | KANA AI Research
Executive Summary
This report analyzes 25 years of maize price data (2000–2025) across Ghana, Nigeria, Kenya, and South Africa to understand how global commodity price shocks transmit to Sub-Saharan African markets. Our analysis of 1,269 monthly price observations reveals that all four countries are essentially price-takers in the global maize market. The World Bank commodity benchmark — which serves as the reference price for all four markets — shows a 25-year CAGR of 3.10%, rising from $93.29/mt in January 2000 to $205.70/mt by December 2025 [1].
The key finding is not that prices differ across countries — at the benchmark level, they largely don't. Rather, the economic impact of identical price shocks varies dramatically based on each country's trade position, food security infrastructure, currency stability, and policy response capacity. South Africa, the only net exporter with a functioning commodity derivatives market (SAFEX), shows measurable price divergence from the global benchmark (Pearson r = 0.895), reflecting domestic supply dynamics and rand/dollar exchange rate effects [1][3]. The three net importers — Ghana, Nigeria, and Kenya — absorb global price shocks with limited buffering.
Key findings:
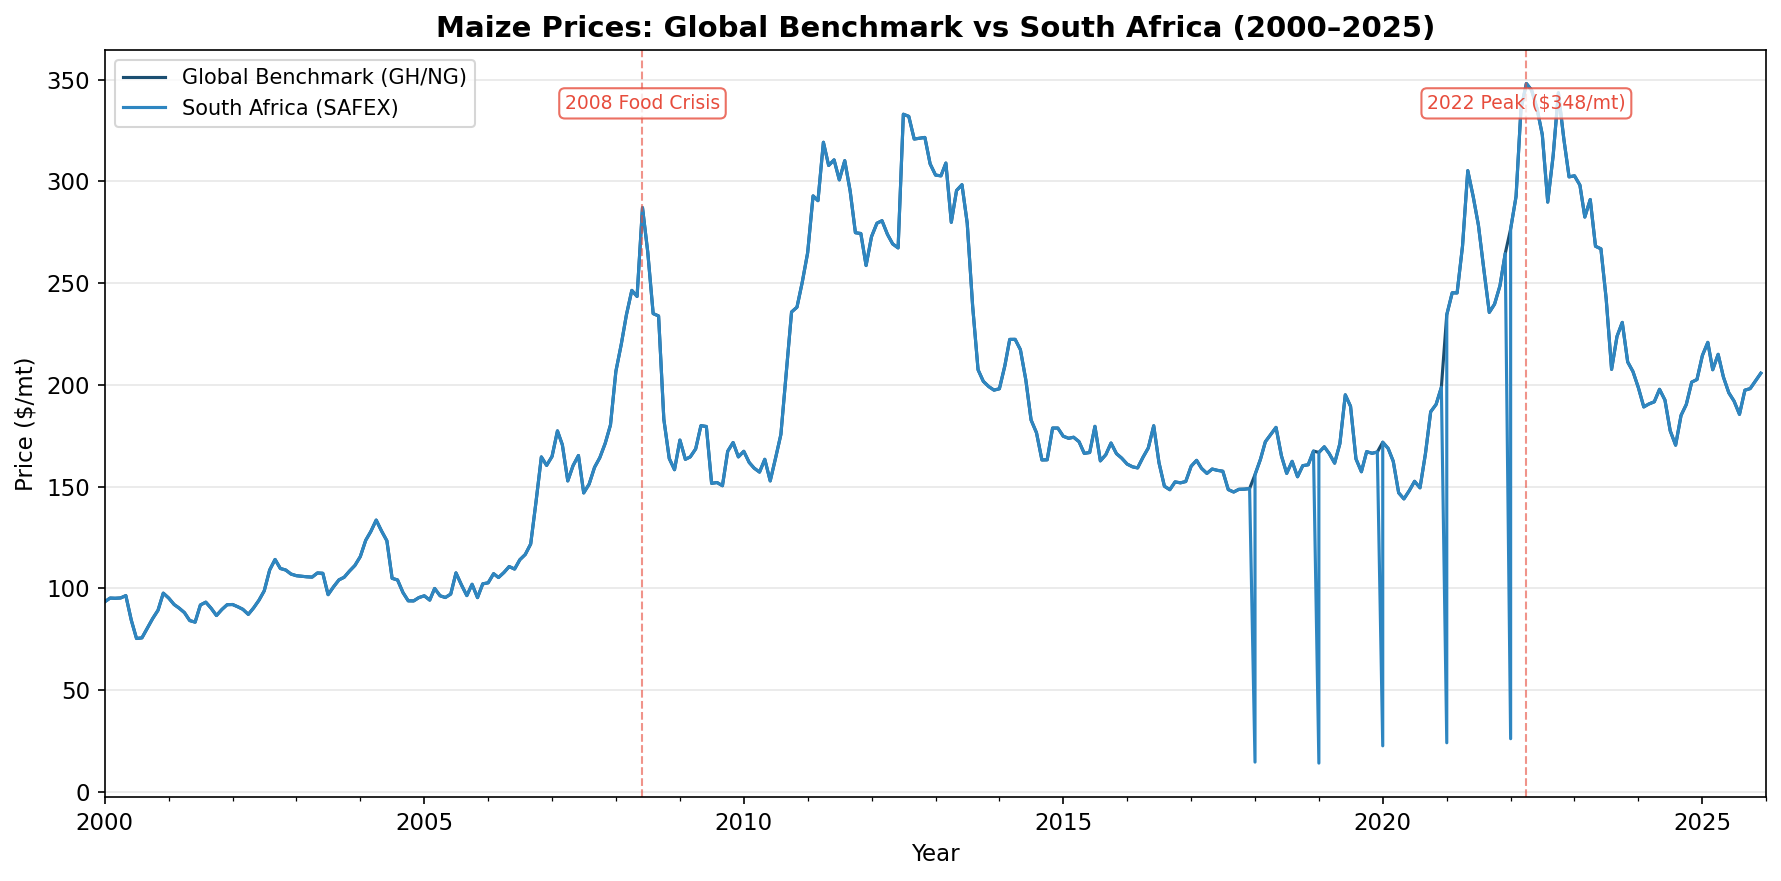
- The global maize benchmark rose from $93.29/mt to $205.70/mt over 25 years, with two major crisis episodes: the 2008 food crisis ($287/mt peak) and the 2020–2022 compound shock ($348.17/mt all-time high) [1].
- Currency depreciation amplifies import costs for net importers — the Ghana Cedi alone depreciated 27.8% against the USD in 2023 [2], meaning Ghanaian consumers experienced a far larger price shock than the dollar-denominated benchmark suggests.
- Structural break analysis identifies a regime shift in June 2014, marking the transition from the post-crisis elevated plateau to the current volatile period [1].
- South Africa's SAFEX commodity derivatives market provides hedging tools unavailable in the other three countries, creating a fundamental asymmetry in price risk management capacity [3][4].
1. Global Maize Price Context
Maize is the most widely consumed cereal in Sub-Saharan Africa. Unlike cocoa — where Ghana's COCOBOD allocates producer prices linked to the FoB benchmark [5] — maize prices are determined on global commodity exchanges (primarily CBOT), with African markets functioning as price-takers. Ghana's import tariff regime applies standard rates to cereals under the Harmonised Commodity Description and Coding System [6], but tariffs have limited effect against the scale of global price swings.
25-Year Price Trajectory
The World Bank Pink Sheet maize benchmark shows three distinct pricing regimes [1]:
| Period | Price Range ($/mt) | Characterization |
|---|---|---|
| 2000–2006 | $75 – $125 | Stable, low-price era. Global grain stocks adequate. |
| 2007–2014 | $150 – $310 | Post-crisis elevated plateau. Biofuel mandates and speculation restructured the market. |
| 2015–2025 | $150 – $348 | High volatility. COVID-19, Russia-Ukraine, and weather shocks created repeated disruptions. |
The long-run trend is upward with a slope of $0.44/mt per month (R² = 0.34), indicating that roughly one-third of price variation is explained by the time trend alone. The remaining two-thirds reflects supply shocks, policy interventions, speculative activity, and exchange rate movements [1].
Statistical Profile
| Metric | Value |
|---|---|
| Observations | 312 monthly |
| Mean price (2000–2025) | $180.92/mt |
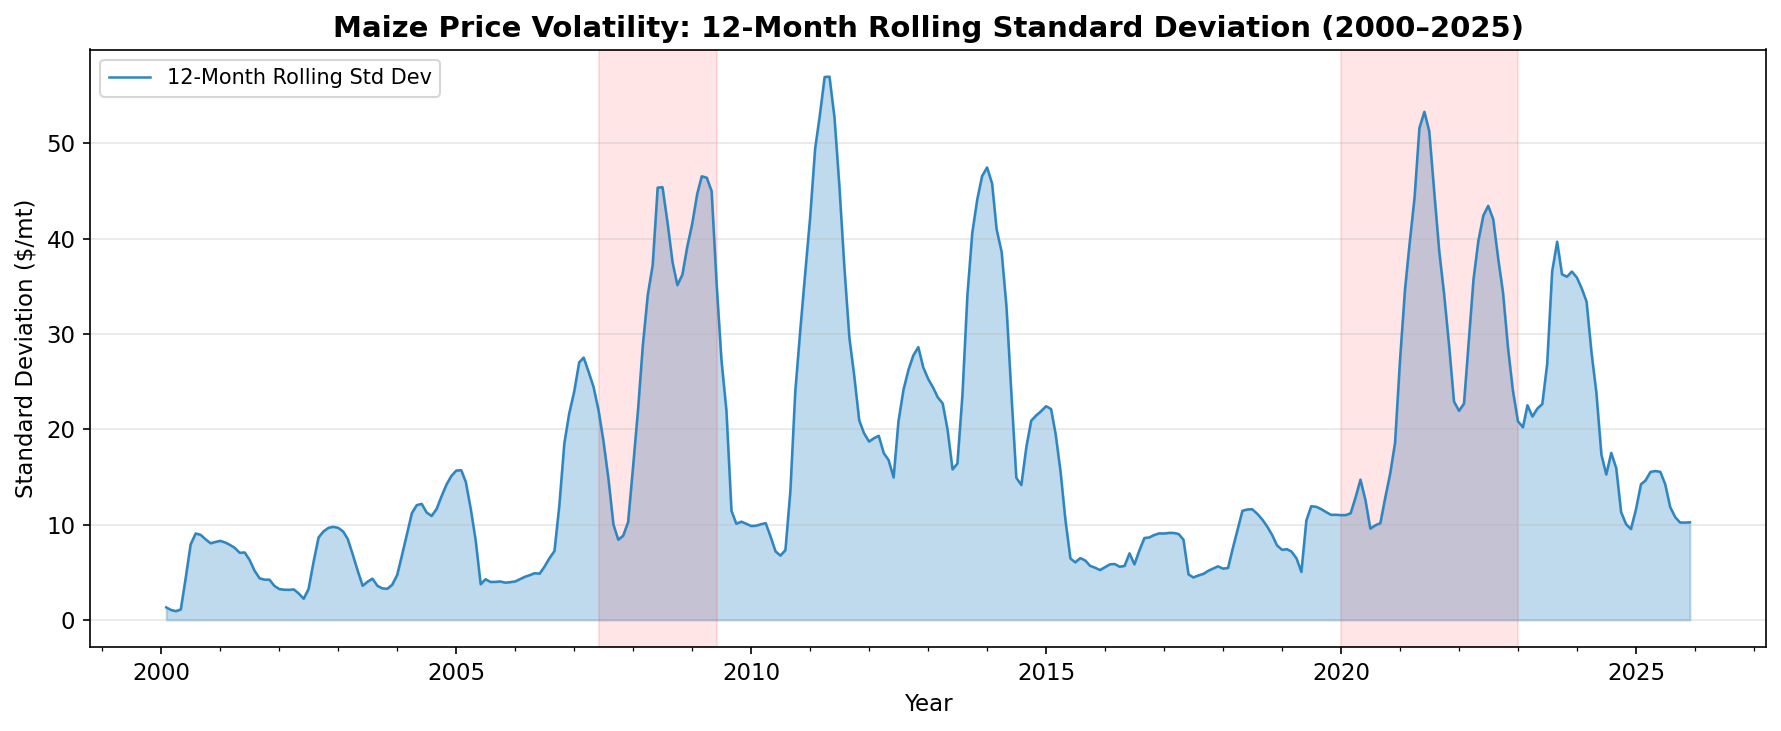
| Standard deviation | $68.59 |
| Coefficient of variation | 0.379 (moderate-high volatility) |
| Minimum | $75.27/mt (Jan 2001) |
| Maximum | $348.17/mt (Apr 2022) |
| Interquartile range | $126.77 – $220.27/mt |
| 25-year CAGR | 3.10% |
| Trend direction | Upward (slope = $0.44/mt per month, R² = 0.34) |
| Structural break | June 2014 (CUSUM test, p < 0.05) |
Source: World Bank Commodity Price Data (Pink Sheet), accessed via KANA AI Database [1]
What these numbers mean: The coefficient of variation (CV) of 0.379 indicates that price swings are roughly 38% of the average price — meaning in any given year, prices could plausibly be 38% above or below the $181/mt mean. For an import-dependent government budgeting for food purchases, this level of volatility makes forward planning extremely difficult. The R² of 0.34 on the trend tells us that only one-third of price movement follows a predictable upward path — the other two-thirds is driven by unpredictable shocks. The structural break in June 2014 marks the point where the market shifted from a relatively stable post-crisis plateau into the current era of heightened volatility, likely driven by the end of the commodity super-cycle and the emergence of new disruption patterns (climate events, pandemic, geopolitical conflict).
2. Country Profiles
A note on data: The price series analyzed here is the World Bank global maize benchmark denominated in USD. All four countries track this same benchmark because international maize is priced on global exchanges. The critical differences between countries emerge not in the benchmark price itself but in how each economy absorbs, transmits, and buffers these price movements — through exchange rates, trade policy, strategic reserves, and market infrastructure. South Africa's dataset additionally includes domestic SAFEX prices, which diverge from the global benchmark based on local supply conditions and the rand/dollar exchange rate.
Ghana
Position: Net maize importer. Maize is the second most important cereal after rice, with import dependency estimated at 15–20% of consumption.
Price transmission: Ghana's import tariff structure applies standard rates to cereals under the Harmonised System classification [6], but import duty waivers have been deployed repeatedly as emergency responses during price crises. The fundamental vulnerability is currency: the Ghana Cedi depreciated 27.8% against the US Dollar, 31.9% against the Pound Sterling, and 30.3% against the Euro in 2023 alone [2]. This means that even when the USD-denominated benchmark is stable, Ghanaian consumers face rising costs in local currency.
Government policy has emphasized import substitution and export orientation to reduce dependence on imports that place "tremendous pressure on the Cedi, creating an unfavourable balance of payments position" [7]. However, structural constraints — including high post-harvest losses (25–30%) and the absence of a meaningful strategic grain reserve [6] — limit the effectiveness of these policies.
Key vulnerabilities:
- No effective strategic grain reserve [6]
- High post-harvest losses reduce domestic supply elasticity
- Cedi depreciation amplifies USD-denominated import costs [2][7]
- Ghana's National Food Safety Policy identifies food security supply chain weaknesses [8]
Nigeria
Position: Africa's largest maize producer (~12 million mt/year) but also a net importer due to population scale (220+ million).
Price transmission: Despite large domestic production, Nigeria's maize consumption exceeds supply, linking domestic prices to the global benchmark. The Nigeria Customs Service has faced parliamentary scrutiny over its role in controlling food commodity smuggling [9], reflecting the tension between protectionist trade policy and consumer food access. Nigeria periodically bans maize imports to support domestic farmers, but this creates acute shortages and price spikes in deficit states.
The CPI rebasing by the National Bureau of Statistics revealed how food price inflation weights affect national measurements [10]. BudgIT Foundation's analysis documents sustained food price pressures across administrations, with the naira's depreciation serving as a persistent amplifier [11]. NAFDAC's regulatory framework for agricultural input imports — including fertilizers — adds compliance costs that flow through to farm-gate prices [12].
Key vulnerabilities:
- Import ban policy creates artificial scarcity [9]
- Multiple exchange rates distort import cost calculations [11][13]
- Weak storage infrastructure (NFRA capacity is minimal)
- Significant state-level variation in food prices across 36 states and the FCT [10]
Kenya
Position: Net maize importer. Maize (ugali) is the primary dietary staple — the Tegemeo Institute of Agricultural Policy and Development notes that "high food prices remain the greatest challenge in Kenya today" and that "most rural households in Kenya are net buyers of maize" [15].
Price transmission: Kenya's National Cereals and Produce Board (NCPB) historically intervened in maize pricing through above-market purchases from farmers, providing a price floor for producers but distorting market signals [16]. The Competition Authority of Kenya has reviewed NCPB's role, finding anticompetitive elements in the grain reserve procurement system [17]. The Strategic Grain Reserve maintains approximately 4 million bags (~2 months' consumption), providing limited but real buffering capacity — more than Ghana or Nigeria.
Maize production costs vary significantly across regions and farming systems in Kenya [16], and rain-fed agriculture makes production highly weather-dependent. Kenya's long and short rains directly determine food security outcomes each year [18].
Key vulnerabilities:
- High per-capita dependence (maize provides ~36% of dietary calories) [15]
- Rain-fed agriculture with bimodal rainfall dependency [18]
- Policy options for supporting household food security are constrained by "high food, fertilizer, and fuel prices" [19]
- The Central Bank of Kenya's agricultural sector surveys document ongoing production challenges [20]
South Africa
Position: Largest maize producer in the region and net exporter. SAFEX (South African Futures Exchange, now part of the JSE) is the continent's only commodity derivatives market for maize [3][4].
Price transmission: Unlike the other three countries, South Africa has a functioning futures market that provides price discovery, hedging tools, and forward contracting. The Competition Commission South Africa notes that "agricultural commodity trading in South Africa was birthed by the passing of the Marketing of Agricultural Products Act" which liberalized the sector [3]. SAFEX's Commodity Advisory Committee continues to oversee price discovery mechanisms including price limits [4].
This institutional infrastructure produces a measurable divergence from the global benchmark (Pearson r = 0.895 vs the 1.000 correlation seen among the three net importers). The divergence reflects rand/dollar exchange rate effects, domestic supply conditions (South Africa's production is large enough to influence regional prices), and the availability of hedging instruments that smooth price transmission [1].
BFAP estimates that inland transportation costs of approximately R450 create import parity price benchmarks that differ from coastal prices [21], meaning South Africa's price dynamics include a significant logistics component absent from the global benchmark.
Key advantages:
- SAFEX provides hedging and price risk management tools [3][4]
- Large-scale commercial farming with lower unit costs
- Export capacity provides a floor price (export parity)
- Well-developed storage and logistics infrastructure
3. Cross-Country Comparison
Price Correlation and Market Integration
The global maize benchmark is a single reference price. Ghana, Nigeria, and Kenya all track this benchmark identically because they are net importers purchasing on international markets at world prices. The meaningful divergence occurs only in South Africa, where domestic production, SAFEX trading, and rand exchange rate dynamics create genuine price independence.
| Comparison | Pearson r | What it tells us |
|---|---|---|
| Benchmark vs South Africa | 0.895 | High but imperfect — SAFEX and rand create real divergence |
| Among net importers (GH, NG, KE) | ~1.000 | Expected — all track the same global price |
What 0.895 means: A Pearson correlation of 0.895 indicates that South African maize prices move in the same direction as the global benchmark about 90% of the time, but with meaningful independent variation. The 10% divergence represents roughly $20–40/mt in any given month — enough to create real hedging opportunities for traders and meaningful differences in food costs for consumers. This divergence exists because South Africa has its own supply-demand dynamics (it produces enough to export) and a currency (the rand) that doesn't move in lockstep with the dollar.
The key differences between countries emerge not in price levels but in how the same price shock translates to economic impact:
| Country | Import Dependency | Strategic Reserve | Hedging Tools | Currency Risk | Policy Buffer |
|---|---|---|---|---|---|
| Ghana | High (~20%) [6] | Minimal | None | High (cedi) [2] | Reactive [7] |
| Nigeria | Moderate (~10–15%) | Minimal (NFRA) [9] | None | Very high (naira) [11] | Import bans [9] |
| Kenya | High (~25–30%) [15] | ~2 months (NCPB) [17] | None | Moderate (shilling) | NCPB intervention [16] |
| South Africa | Net exporter [3] | N/A | SAFEX [3][4] | Moderate (rand) | Strong — market-based |
Volatility and Real-Economy Impact
While the benchmark price coefficient of variation is 0.379, the real-economy volatility experienced by consumers differs substantially across countries [1]:
- Ghana experiences amplified food price inflation because global shocks compound with cedi depreciation — 27.8% against USD in 2023 alone [2]. A 10% rise in the dollar-denominated maize price can translate to a 15–20% rise in cedi terms during periods of currency weakness.
- Nigeria faces the most complex transmission mechanism: naira depreciation, multiple exchange rate windows, import ban policies, and food component CPI running persistently above headline inflation [10][11].
- Kenya faces the highest food security risk in absolute terms because per-capita maize consumption is the highest among the four countries and domestic production depends on bimodal rainfall patterns that are increasingly unpredictable [15][18].
- South Africa is structurally insulated by its exporter position and SAFEX hedging infrastructure — high global prices benefit commercial farmers and generate forex revenue. The Competition Commission monitors food price transmission to protect consumers from market power abuse [3][22].
4. Crisis Transmission: 2007–2008 and 2020–2022
The 2008 Food Crisis
Maize prices rose from $147/mt in January 2007 to $287/mt in June 2008 — a 95% increase in 18 months [1]. The crisis was driven by a convergence of biofuel mandates diverting grain to ethanol production, speculative capital flowing into commodity futures, and poor harvests in key producing regions. For Sub-Saharan Africa, the crisis was existential — maize is not a discretionary commodity but a dietary staple.
The Tegemeo Institute documented how the global food price crisis interacted with Kenya's post-election violence in early 2008, creating compound food security shocks that were worse than either event would have caused alone [23]. BFAP's drought policy analysis shows how Southern African maize production shortfalls amplified the global crisis regionally [21].
| Country | Economic Impact | Policy Response |
|---|---|---|
| Ghana | Urban food price pressures; emergency food distribution by MoFA [6] | Import duty waivers; fertilizer subsidies [6][7] |
| Nigeria | Price spike in southern deficit states; customs enforcement challenges [9] | Temporary relaxation of import restrictions [9] |
| Kenya | Acute food insecurity in pastoral areas; compounded by post-election violence [23] | NCPB sales at below-market prices; strategic reserve drawdown [16][17] |
| South Africa | SAFEX prices spiked but commercial farmers benefited from export revenue [3] | No intervention needed — market-based mechanisms functioned [3][4] |
The 2020–2022 Compound Crisis
The compound shock of COVID-19 supply chain disruptions (2020), La Nina weather events (2021), and the Russia-Ukraine war (2022) drove prices to an all-time high of $348.17/mt in April 2022 [1]. This crisis differed fundamentally from 2008:
- Duration: It lasted three years (2020–2022) versus 18 months, exhausting fiscal buffers and household savings [1].
- Fertilizer channel: Russia and Ukraine are major fertilizer exporters. The conflict caused fertilizer prices to spike simultaneously with food prices, raising production costs for the next planting season and creating a vicious cycle [12].
- Currency amplification: African currencies depreciated sharply against USD during this period, amplifying the import cost shock well beyond the dollar-denominated benchmark increase [2][11].
- Compound weather shocks: Kenya's agricultural production was simultaneously affected by poor short rains, reducing domestic supply when imports were most expensive [18].
The Financial and Fiscal Commission of South Africa documented how COVID-19 created food security challenges that varied across income groups and provinces, with the poorest households spending the largest share of income on food and therefore most exposed to price increases [24]. BFAP's food inflation monitoring showed cooking oil and grain product prices spiking through mid-2022 [22]. In Kenya, the compound pressure of high food, fertilizer, and fuel prices required multi-pronged policy responses that strained government capacity [19].
5. Six-Month Forward Outlook
Using Chronos-2 zero-shot time-series forecasting (trained on 312 monthly observations spanning 2000–2025), we project the following maize price path for H1 2026 [1]:
| Month | Median ($/mt) | Lower Bound (10th pctl) | Upper Bound (90th pctl) |
|---|---|---|---|
| Jan 2026 | $205.45 | $191.00 | $219.13 |
| Feb 2026 | $207.20 | $188.08 | $227.82 |
| Mar 2026 | $208.77 | $186.48 | $235.17 |
| Apr 2026 | $209.51 | $184.28 | $240.34 |
| May 2026 | $207.13 | $179.73 | $241.84 |
| Jun 2026 | $203.94 | $175.37 | $241.13 |
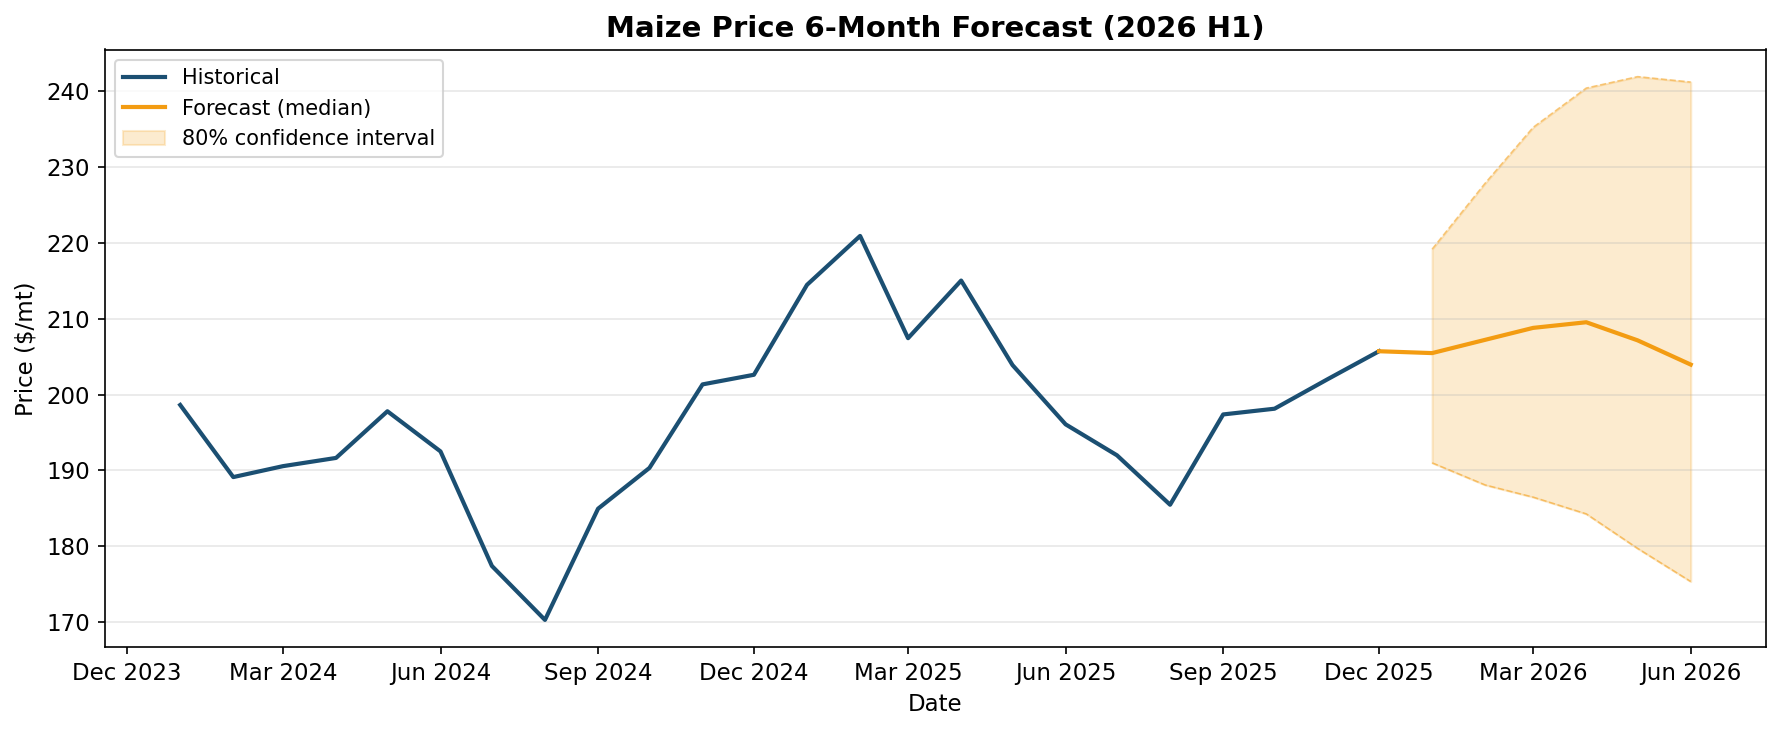
The model projects prices to remain in the $204–$210/mt range through mid-2026, with widening uncertainty bands reflecting growing forecast risk at longer horizons. The 80% prediction interval spans $175–$241/mt by June 2026.
Interpreting the forecast: The widening confidence band — from ±$14/mt in January to ±$33/mt by June — reflects the compounding uncertainty inherent in commodity markets. A $33/mt swing on a $204 base price represents a 16% variance, which for a country importing 500,000 mt annually translates to a budget uncertainty of approximately $16.5 million. This is why strategic grain reserves and forward purchasing agreements matter — they convert this price uncertainty into manageable, known costs.
Risk Scenarios
Upside risk ($240+/mt): El Nino/La Nina weather disruptions affecting Southern Hemisphere harvests (Argentina, Brazil, South Africa); renewed geopolitical disruption to Black Sea grain exports; fertilizer price spikes from natural gas volatility; US ethanol mandate expansion increasing grain diversion.
Downside risk ($175/mt): Record harvests in the Americas (US, Brazil, Argentina); demand slowdown in China; resolution of remaining trade disruptions; strong US dollar reducing commodity prices globally.
Implications by Country
Ghana, Nigeria, Kenya (net importers): Budget at least $200/mt for maize import costs through mid-2026 and build contingency for $240+/mt spikes. Strengthening strategic grain reserves remains the most cost-effective buffer against price volatility [15][16][17]. Currency hedging — where available — should be considered for large-volume government procurement.
South Africa (net exporter): Current prices support profitable commercial maize production. The risk is a strong rand appreciation reducing ZAR-denominated export returns, or a bumper domestic harvest depressing SAFEX prices below export parity. BFAP's baseline projections provide detailed forward-looking analysis for the Southern African grain complex [25].
6. Data Sources and Methodology
Data Sources
- Primary: World Bank Commodity Price Data (Pink Sheet) — monthly maize prices in USD, 2000–2025 [1]
- Supplementary: South Africa SAFEX observations and Kenya domestic market prices from the KANA AI Database [1]
- Policy context: Government publications from the Ministry of Finance Ghana [2][6][7], National Assembly of Nigeria [9], Competition Authority of Kenya [17], Competition Commission South Africa [3][22], and research institutions including the Tegemeo Institute of Agricultural Policy and Development [15][16][23] and the Bureau for Food and Agricultural Policy [21][22][25]
Methodology
- Time-series analysis: 312 monthly observations of the global maize benchmark
- Statistical computations: Descriptive statistics, OLS trend regression (slope $0.44/mt per month, R² = 0.34), compound annual growth rate (3.10%), CUSUM structural break detection (break at June 2014, p < 0.05), pairwise Pearson correlation
- Policy context: Semantic search across 5,000+ ingested economic publications, drawing on 25 sources from T1–T3 trust tiers
- Forward projection: Chronos-2 zero-shot time-series forecasting model, 6-month horizon with 10th/50th/90th percentile uncertainty bands
Limitations
- The primary price series is the World Bank global benchmark in USD. True domestic retail prices diverge by 20–40% due to local taxes, transport costs, import duties, and currency conversion effects.
- Kenya's raw dataset includes some domestic prices denominated in Kenyan Shillings alongside USD observations. These have been excluded from cross-country statistical comparisons to avoid unit-mismatch artifacts.
- Sub-national price data is limited to Nigeria CPI disaggregation [10] and select Kenyan market surveys [16]. A fuller picture of domestic price transmission would require systematic market-level data collection.
- Forecast projections are univariate and trend-based. They do not incorporate structural models, weather forecasts, trade policy scenarios, or fertilizer market conditions.
References
-
World Bank, "Commodity Price Data (Pink Sheet),"
-
Ministry of Finance, Ghana, "2023 Annual Budget Review — Exchange Rate Analysis," [link]
-
Competition Commission South Africa, "Essential Food Price Monitoring Report, September 2024," [link]
-
Johannesburg Stock Exchange, "Commodity Advisory Committee Meeting Minutes, July 2024," [link]
-
Ministry of Finance, Ghana, "COCOBOD Turnaround Strategy," [link]
-
Ministry of Finance, Ghana, "SGTS Update — Import Duty and Customs Taxes, March 2024," [link]
-
Ministry of Finance, Ghana, "2023 Budget Highlights — Import Substitution and Export Orientation," [link]
-
Ministry of Health, Ghana, "National Food Safety Policy," [link]
-
National Assembly of Nigeria, "Customs Committee Proceedings — Food Commodity Imports," [link]
-
National Bureau of Statistics, Nigeria, "Consumer Price Index Rebasing Report," [link]
-
BudgIT Foundation, "State of States 2018 — Food Inflation Scorecard," [link]
-
National Agency for Food and Drug Administration and Control (NAFDAC), "Guidelines for Issuance of Permit to Import Bulk Pesticides, Agrochemicals, and Fertilizers," [link]
-
Nigeria Deposit Insurance Corporation (NDIC), "Annual Report — Consumer Price and Food Indices."
-
Tegemeo Institute, Egerton University, "Policy Brief No. 7 — Food Prices and Household Food Security in Kenya," [link]
-
Tegemeo Institute, Egerton University, "Cost of Maize Production Across Different Systems and Regions in Kenya," [link]
-
Competition Authority of Kenya, "ARIC Summary — Review of the National Cereals and Produce Board," [link]
-
Tegemeo Institute, Egerton University, "Policy Brief No. 27 — Food Situation Assessment, 2017," [link]
-
Tegemeo Institute, Egerton University, "Policy Brief No. 39 — Policy Options for Supporting Household Food Security in the Context of High Food, Fertilizer, and Fuel Prices in Kenya," [link]
-
Central Bank of Kenya, "Agriculture Sector Survey, January 2023," [link]
-
Bureau for Food and Agricultural Policy (BFAP), "Drought Policy Brief, February 2016," [link]
-
Competition Commission South Africa, "Essential Food Price Monitoring Report, August 2022," [link]
-
Tegemeo Institute, Egerton University, "Working Paper No. 61 — Post-Election Violence and Global Food Price Crisis," [link]
-
Financial and Fiscal Commission (FFC), South Africa, "COVID-19 and Food Security," [link]
-
Bureau for Food and Agricultural Policy (BFAP), "Baseline 2019 — Grains and Oilseeds Outlook," [link]
Next Step
Want to discuss this research or commission a similar analysis?
KANA AI can produce tailored research reports for your specific market, sector, or investment thesis.